Public Charging Infrastructure and Opportunity
The availability of charging infrastructure is a significant factor when consumers make purchasing decisions regarding plug-in electric vehicles (PEVs). While most PEV charging occurs at home, less than half of US vehicles have a dedicated parking space at an owned home where a charger could be installed, limiting home charging installation and, potentially, PEV ownership. Public charging is used less frequently, but it provides important assurance to BEV drivers, encourages them to fully utilize battery range, and alleviates range anxiety. Therefore, adequate access to public charging will likely affect consumer acceptance of PEVs.
Considerable research as been devoted to understanding how to efficiently allocate charging infrastructure. However, researchers at the National Renewables Energy Laboratory (NREL), Oak Ridge National Laboratory (ORNL), and Lamar University are the first to focus on linking public charging infrastructure deployment levels and the probability of drivers accessing public charging during their daily travel activities. This study uses global positioning system (GPS) travel survey data from three metropolitan areas—Puget Sound, Washington; Atlanta, Georgia; and Los Angeles, California—to estimate this relationship. For more detailed information, see "Understanding the Linkage Between Electric Vehicle Charging Network Coverage and Charging opportunity using GPS travel data."
Methodology
Three GPS travel datasets were obtained from the National Renewable Energy Laboratory (NREL) Transportation Secure Data Center:
- Puget Sound Regional Travel Study, Puget Sound, Washington (2014–15)
- Atlanta Regional Travel Survey, Atlanta, Georgia (2011)
- California Household Travel Survey, Los Angeles-Long Beach-Anaheim Metropolitan Statistical Area (MSA) (2010–12)
These datasets describe 890,980 trips by 10,473 drivers at various times between 2004 and 2012. The raw GPS data was aggregated to the trip level for each region. While the analysis is based on travel activity data collected from survey participants driving conventional vehicles, it was assumed that the drivers' travel patterns will not change when driving PEVs.
| Dataset | Survey period | Trip destinations | Percent of trips with public destinations | Drivers | Grid cells with trip destinations | Average dwell time (minutes) | Average trip distance (miles) |
|---|---|---|---|---|---|---|---|
| Puget Sound region | 2004–06 | 720,042 | 30.56% | 448 | 6,616 | 87 | 5.6 |
| Atlanta (ARC) region | 2011 | 49,339 | 25.18% | 910 | 2,610 | 93 | 6.6 |
| Los Angeles-Long Beach-Anaheim MSA | 2010–12 | 121,599 | 25.28% | 9,115 | 7,193 | 100 | 8.2 |
This study looks only at public charging. Therefore, the data was mined for trips that meet the following criteria:
- Trips ending in a destination that is not residential
- Trips where the interval between the ending trip and the next trip is less than 4 hours and the date is a weekday (assumed to not be a workplace)
- Trips where the dwell time is at least 30 minutes (assumed to be the least amount of time to add a useful charge to a vehicle)
Each region was divided into grid cells 0.25 miles by 0.25 miles in size, and each destination was assigned to a cell. If a trip destination is located in a cell with a charging station, the driver can charge there—this assumes that drivers would be willing to walk a short distance between the charging station and their destination.
The study defines charging opportunity as the probability of encountering public charging stations at public trip destinations. It reflects the degree of overlap between the charging network and a driver’s activity space, excluding trips to the home or workplace. Charging station placement was determined using a heuristic method that places stations in grid cells with the largest number of public trips that have them as a destination.
Two ways of estimating charging opportunity were considered:
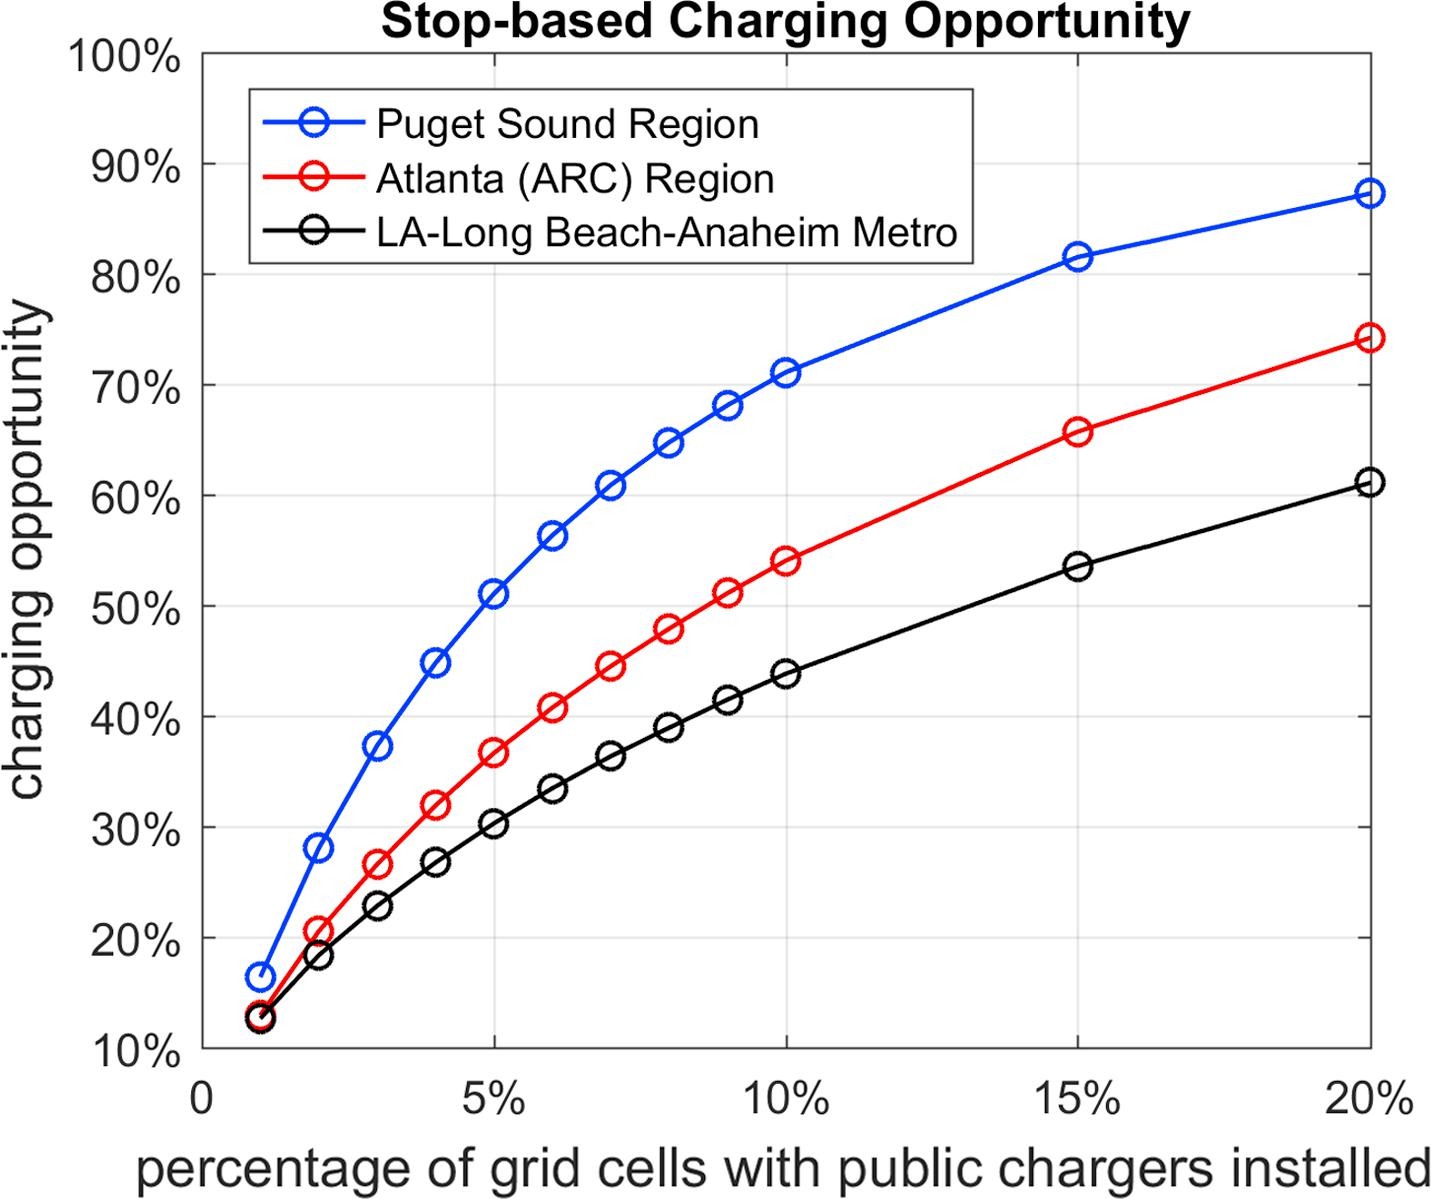
- Stop-based approach. The stop-based approach evaluates the probability of accessing a public charging station at each trip stop. Charging infrastructure is considered accessible if it is located within the grid cell that contains the stop. Charging opportunity is estimated as the ratio of the number of stops with access to installed charging stations to the total number of stops in the dataset.
- Trip-chain-based approach. A trip-chain-based approach evaluates the charging opportunity during a travel day. For this approach, trip-level data was aggregated to daily trip chains. If public chargers are located close to at least one public trip stop of a daily trip chain, charging was considered accessible for that day.
In both approaches, only public stops (not home or workplace) with dwell time longer than half an hour were considered.
Results
Charging Opportunity Analysis
For the stop-based approach, most stops are concentrated in a few popular places. For the Puget Sound region, if only the top 1% of the most popular destinations has public chargers installed (about 66 stations), on average, drivers will be able to access public charging during 16% of all their public stops. If 20% of the most popular places have public chargers installed, drivers will be able to access public charging during 87% of all their public stops. The results for the Atlanta region and Los Angeles MSA (1% network coverage for these regions corresponds to 26 and 72 stations installed, respectively) are less optimistic, but they also exhibit strong patterns of high charging opportunity provided by relatively low network coverage. Although greater charging coverage levels result in higher charging opportunity levels, the concave shape of the plot suggests decreasing marginal benefits would result from placing additional charging stations.
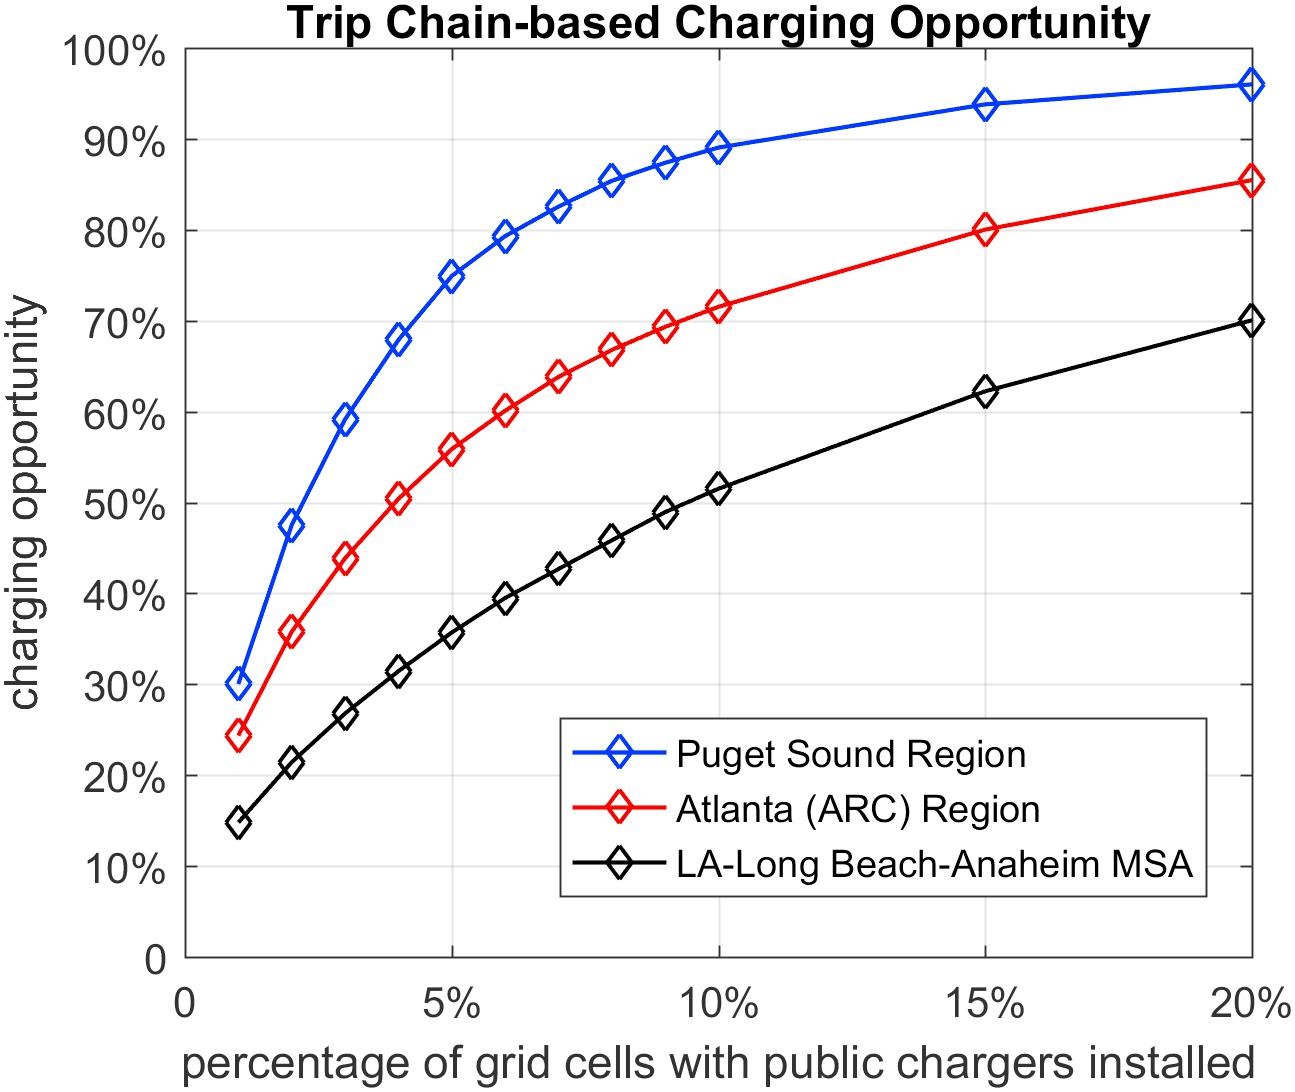
For the trip-chain-based approach, trip stops are also concentrated in popular destinations. For the Puget Sound region, if only the top 1% of the most popular grid cells have public charging installed, on average, drivers will be able to access public charging during at least one stop on 30% of their travel days. If 20% of the most popular grid cells have public chargers installed, the charging opportunity rises to more than 90%, meaning that drivers will be able to access public charging during at least one stop for most of their travel days, even though charging may not be needed, providing a sense of charging infrastructure security. It is estimated that diminishing marginal benefits would be realized from installing additional charging stations. The charging opportunity values for the Atlanta region and the LA-Long Beach-Anaheim metropolitan area are lower compared to the Puget Sound region. However, the Puget Sound observed patterns and conclusions remain the same.
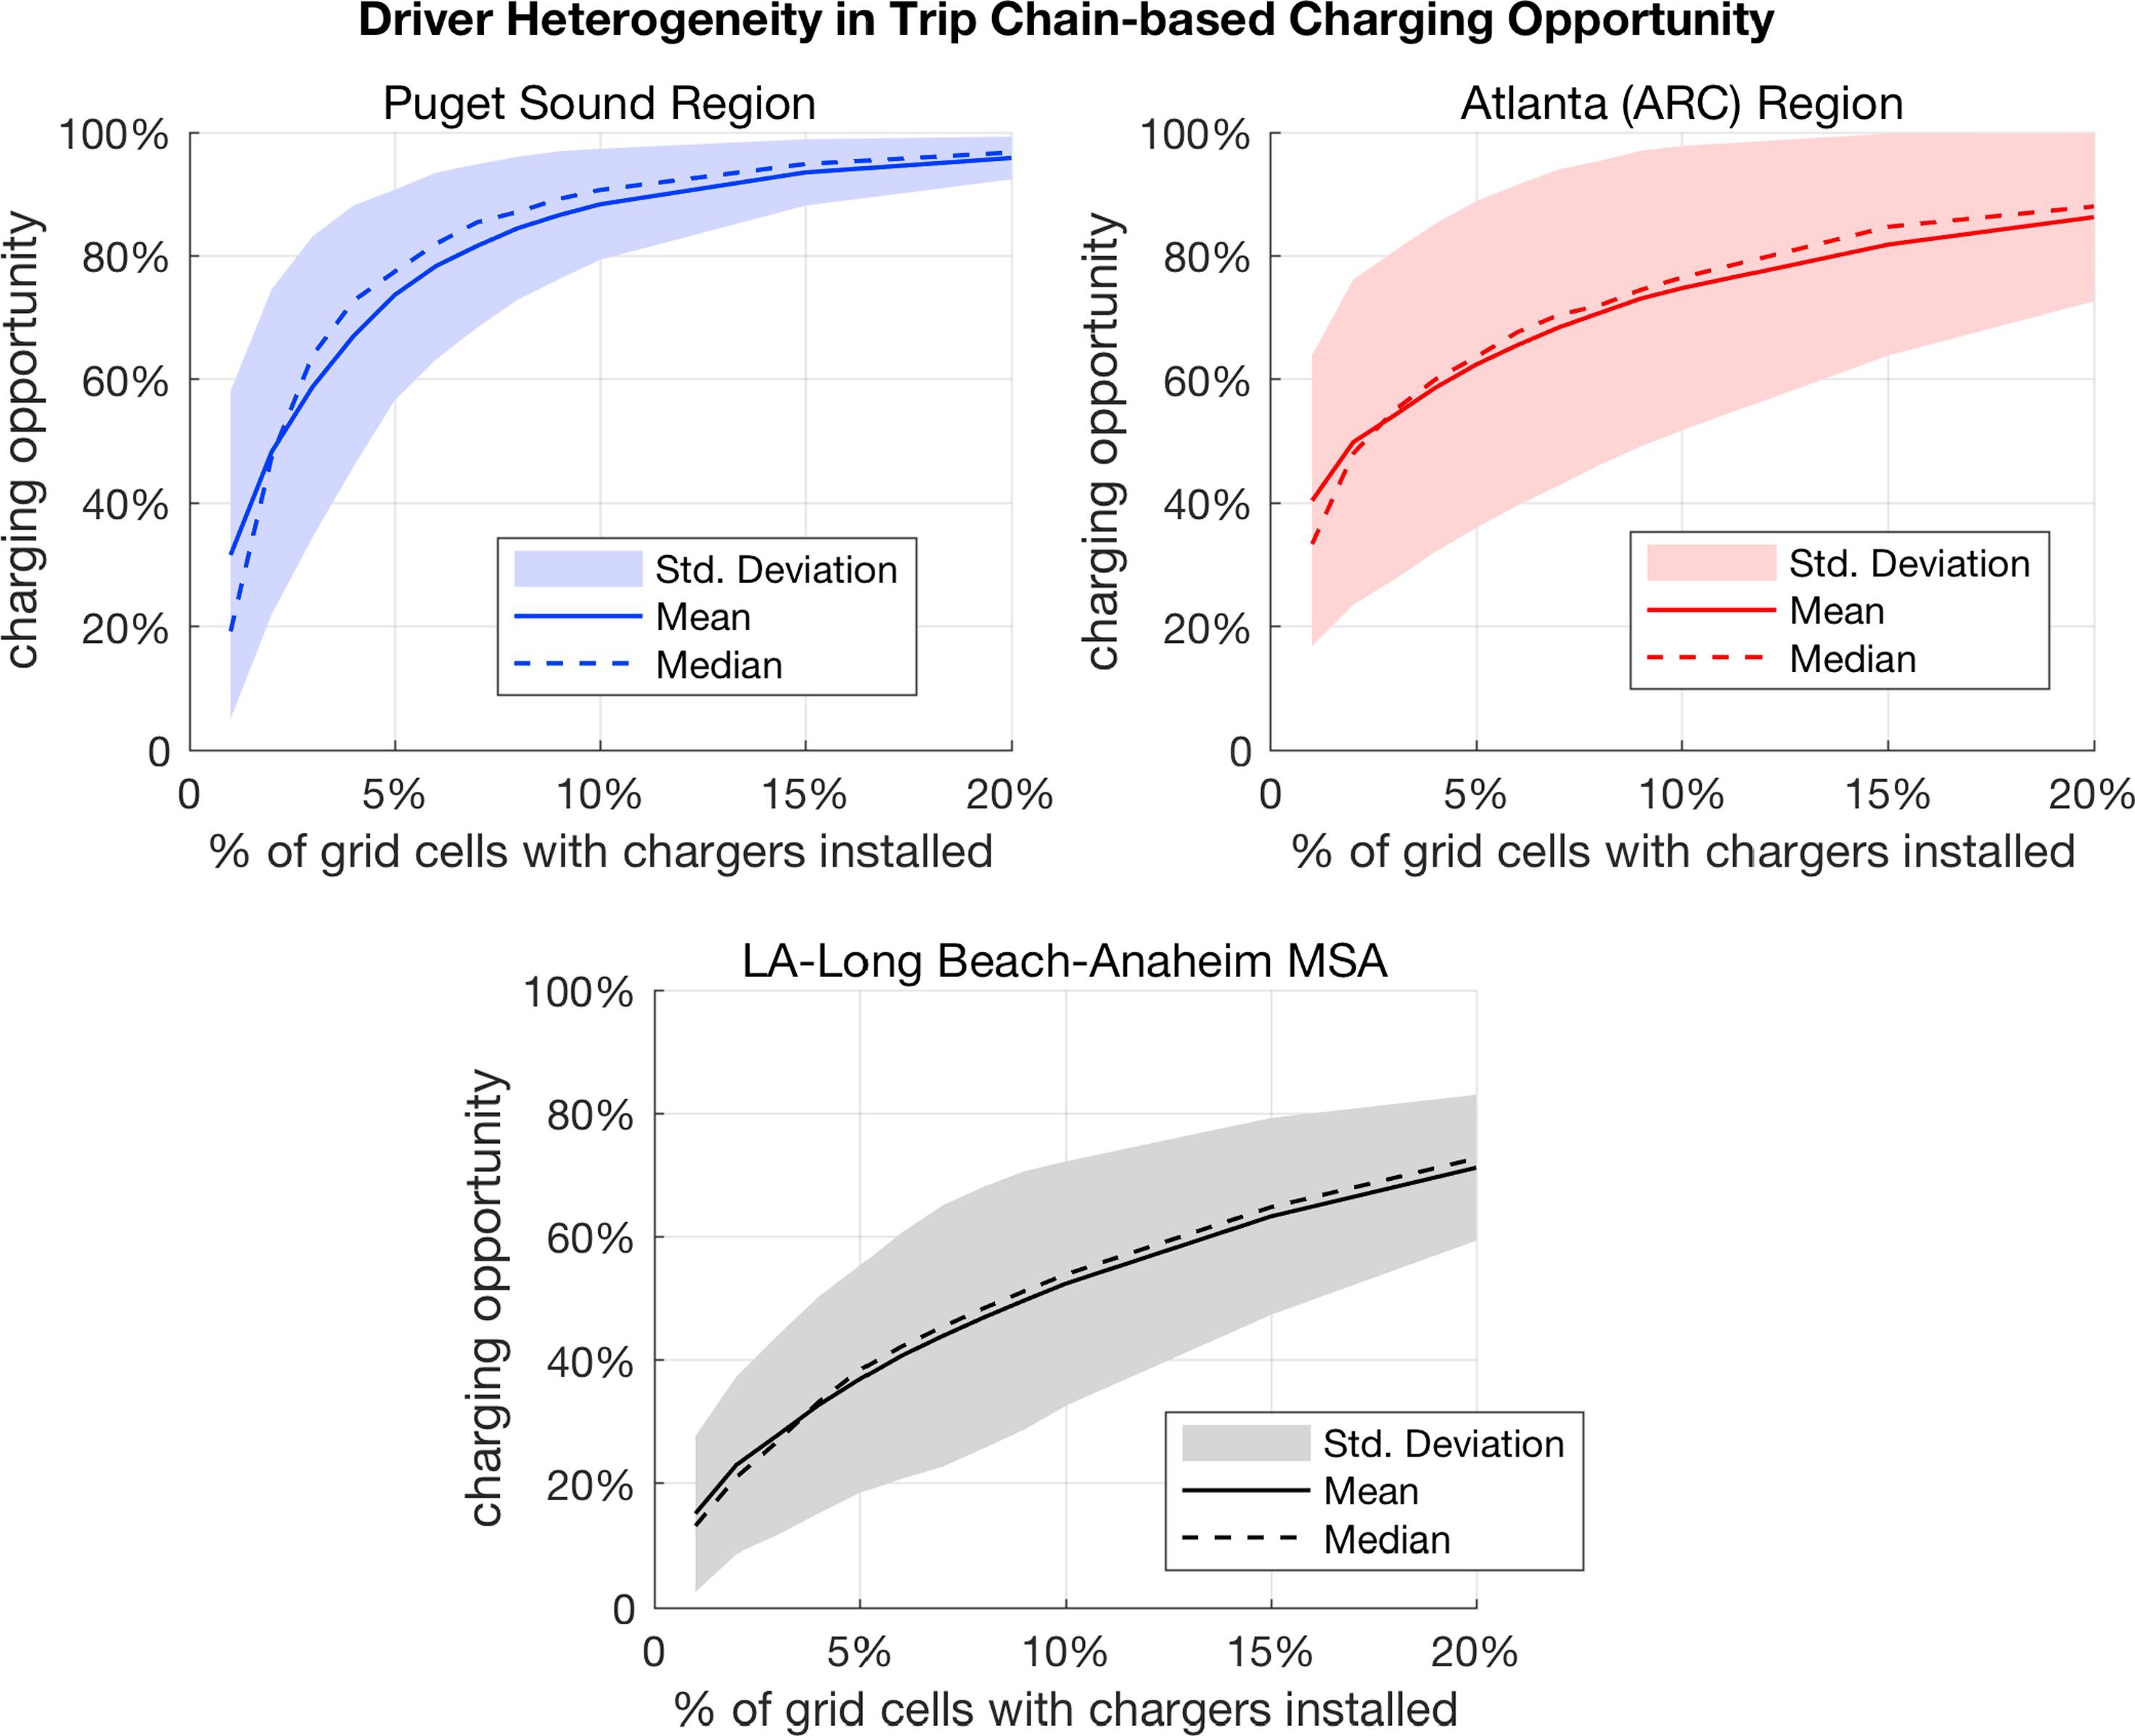
Driver Heterogeneity
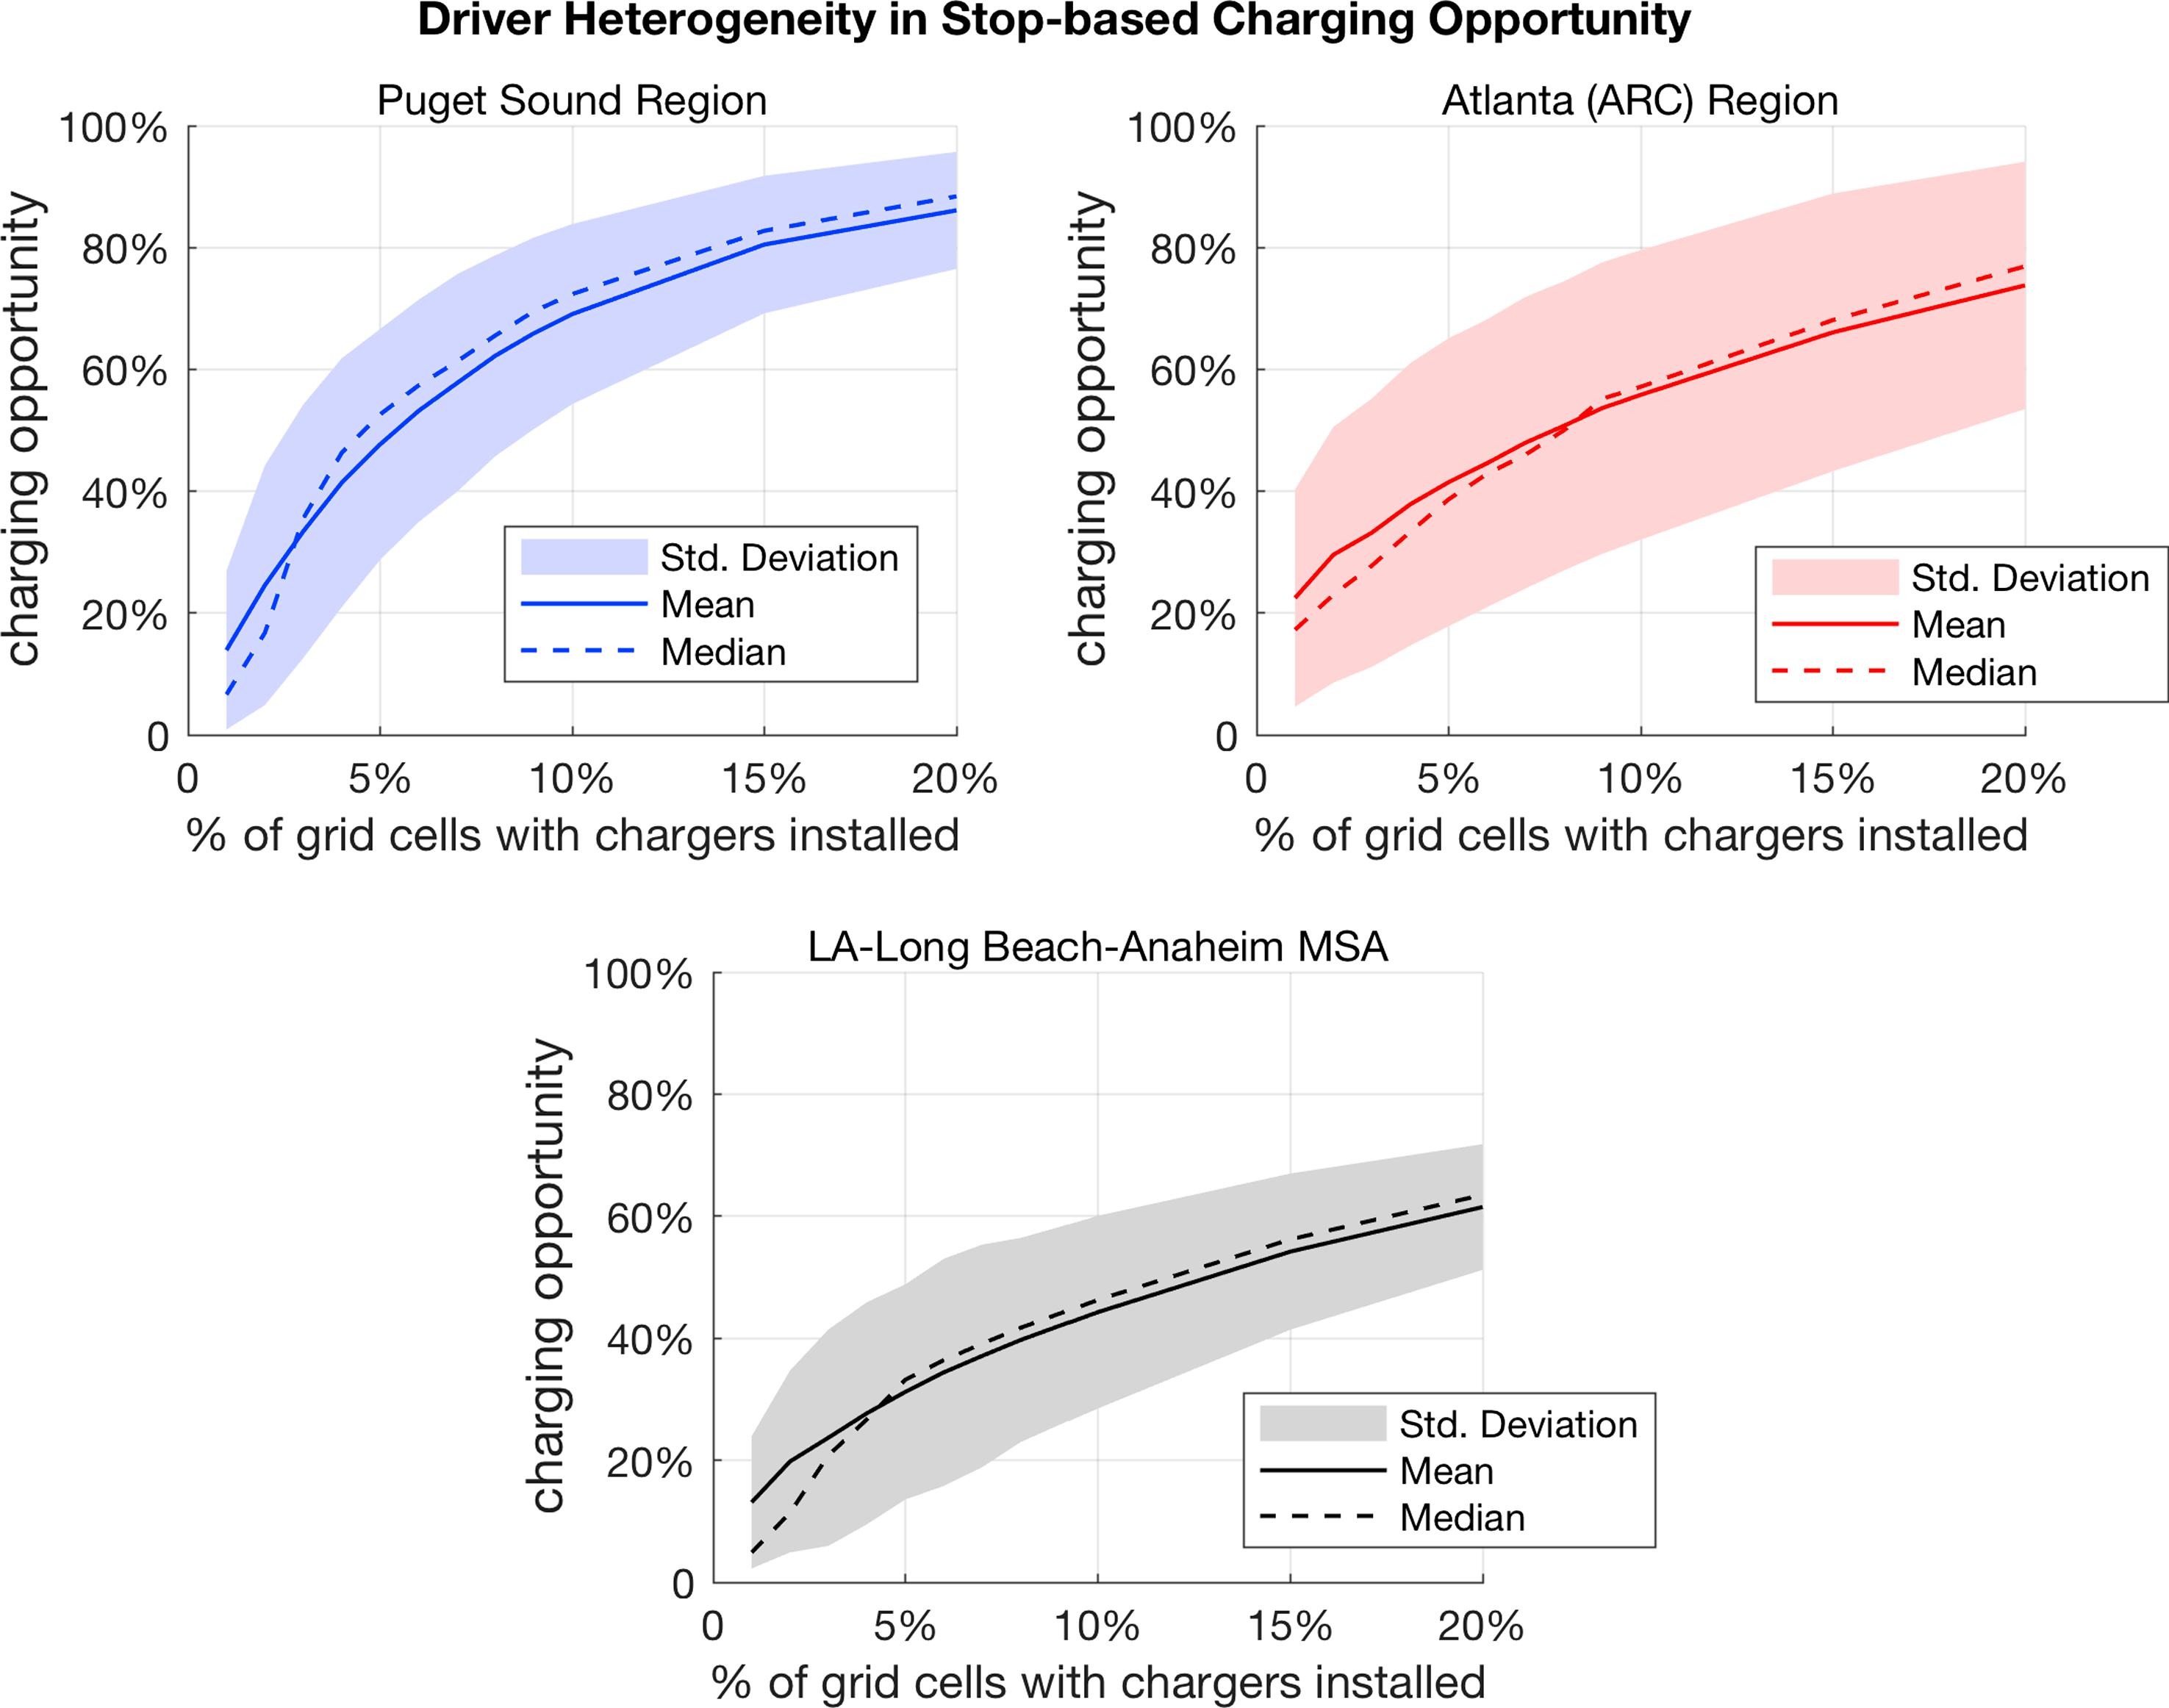
If a driver’s frequent trips do not end in the most popular grid cells with chargers installed, his/her charging opportunity will be lower. Therefore, this study also examines the heterogeneity in charging opportunity among different drivers. For the stop-based approach, an individual driver’s charging opportunity is calculated as the ratio of the public stops with chargers to the total number of public stops made by the driver. For the trip chain-based approach, a driver’s charging opportunity is the ratio of a driver's public travel days with at least one stop in a grid cell with a charger to their total number of travel days. These measures are weighted by the number of trips or trip days for a given driver, so all drivers are not weighted equally.
Note that the mean charging opportunity values presented in Figs. 3 and 4 are similar to, but not exactly the same as, the values portrayed in Figs. 6 and 8. As shown in these diagrams, charging opportunity variations among drivers for all three regions are large—standard deviation is in the range of +20% to −20% at low charging coverage levels and decreases slightly as the coverage increases. Similar to the outcome of the comparison of average stop-based and trip-chain-based charging opportunities, the latter opportunity metric results in higher charging opportunity levels than the former, even when considering driver heterogeneity.
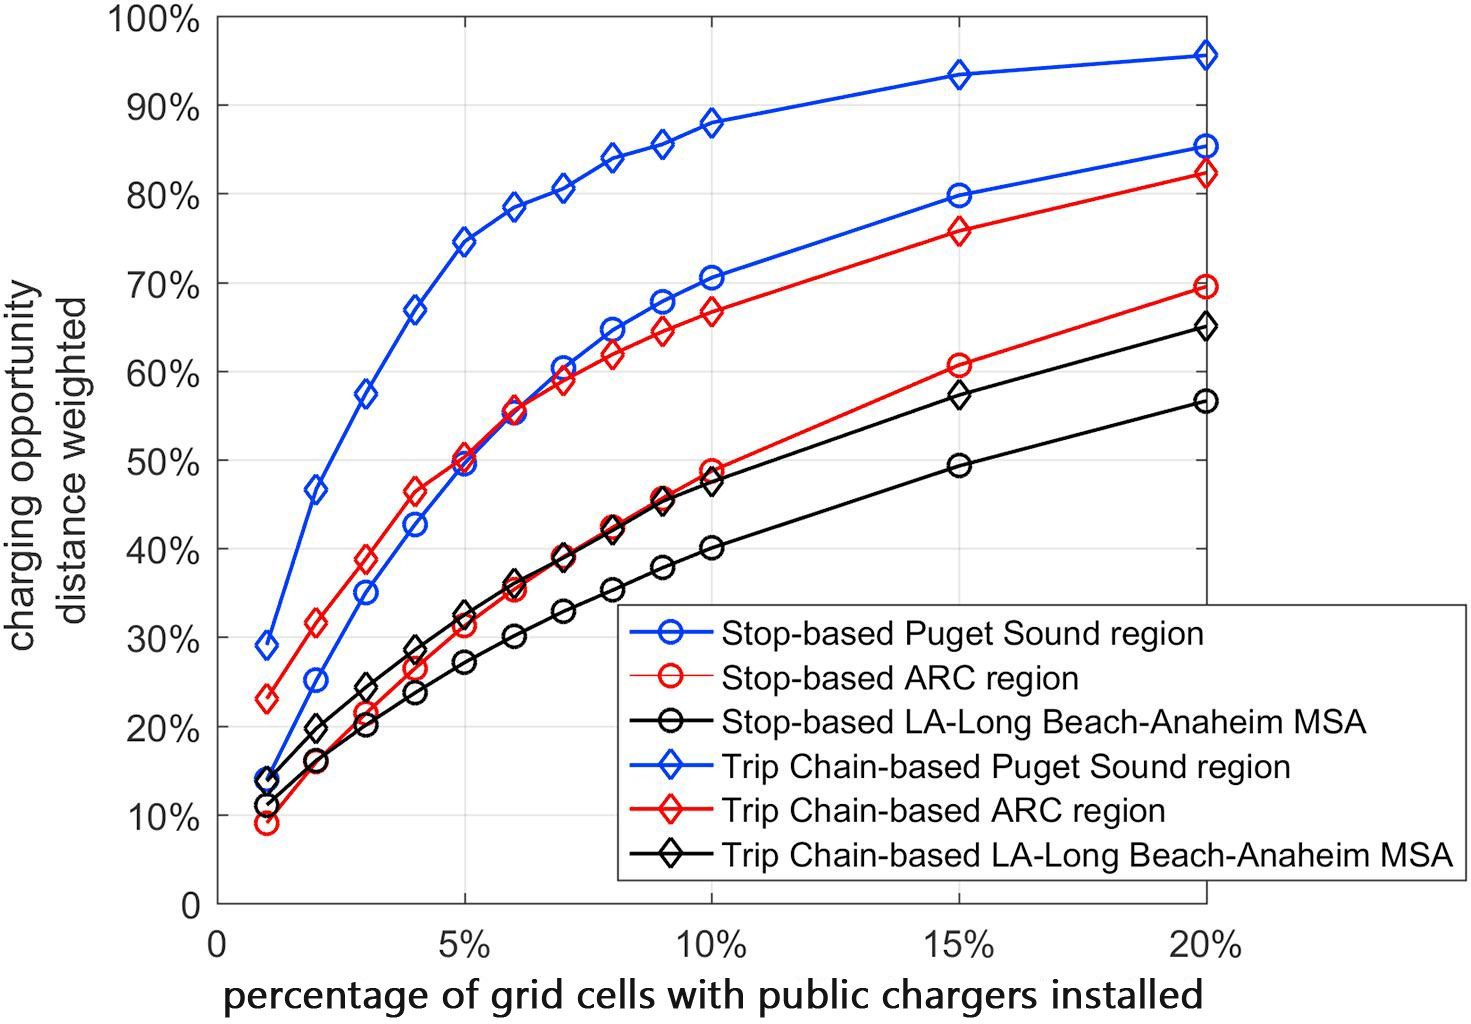
Charging Opportunity Weighted by Travel Distance
This study does not explicitly examine network coverage and charging opportunity in relation to charging needs. However, it does
analyze charging opportunity weighted by travel distance, which may reflect charging needs to some extent. This analysis framework
weights each stop by the distance of the associated trip, ranks grid cells by the number of
distance-weighted stops that fall within each cell, and places a charging station in the top
The stop-based approach calculates charging opportunity as the ratio of the covered stops to the total number of stops, with each stop weighted by the travel distance of the associated trip. The daily trip-chain-based approach calculates charging opportunity as the ratio of covered travel days to the total number of travel days, with each travel day weighted by the total daily travel distance.
Fig. 5 shows similar trends as in Figs. 1 and 2 but with lower charging opportunity levels achieved for both metrics presented compared to the initial case. As expected, the initial travel approach is more efficient in providing charging opportunity when installing charging stations in the most popular places. By contrast, the travel-distance-weighted approach factors-in charging needs by giving more weight to places that are less popular but may be essential for meeting some drivers' charging needs.
Conclusions
Understanding the relationship between public charging deployment levels and charging opportunity is of great interest to PEV automakers, Electric Vehicle Supply Equipment (EVSE suppliers) and providers, and the government—anyone with an interest in expanding the PEV market from early adopters to the mass market, which might be more sensitive to the lack of public charging. The analysis findings imply that charging networks can be efficiently designed by concentrating charging stations in a few popular places while still providing a relatively high level of charging opportunity although this efficiency can vary significantly by region. The results also show that charging opportunity among PEV drivers within a region vary significantly—the standard deviation in this study ranges from 20% to −20%. Therefore, balancing efficiency and equity in providing charging opportunities would be an important consideration in the public EVSE planning and deployment processes.
The stop-based charging opportunity would be useful as a conservative measure of charging station visibility, while the daily trip-chain-based charging opportunity would serve as a more lenient measure. When a region is characterized by significant heterogeneity of travel patterns, the estimation of stop-based and trip-chain-based charging opportunity with driver heterogeneity would capture such effects. A major disadvantage of these methods is that they do not account for the state of charge of a PEV. A way to address this issue and account for energy consumption over the day is by computing the charging opportunity metric that is weighted by the trip’s driving distance. Planners and policy makers may consider and compare all suggested metrics of PEV charging opportunity when preparing for EVSE deployment in their region.