Objectives
The Pandemic Oil Demand Analysis (PODA) model projects motor gasoline demand for the medium-term—three months into the future—based on the evolution of the COVID-19 pandemic and the resulting changes in travel mobility. By connecting the ongoing changes in personal travel patterns and evolution of the COVID-19 pandemic, the PODA model offers an understanding of gasoline demand that can be beneficial to economic and transportation energy planning and policy discussions.
For more detailed information, see our publication: Machine learning model to project the impact of COVID-19 on US motor gasoline demand.
Fuel Demand Projections
The projection is updated on August 14, 2020, and is simulated based on inputs from the U.S. EIA by August 7, 2020
Model Structure
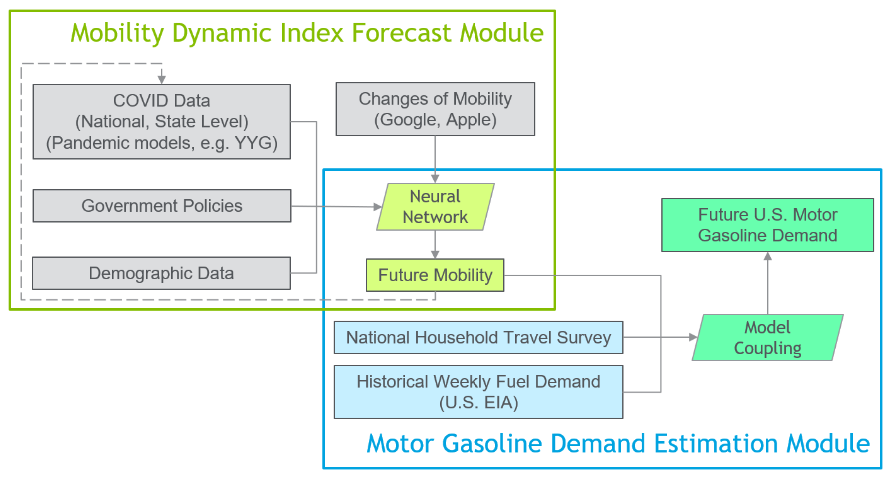
The PODA model is composed of two major modules:
- The Mobility Dynamic Index Forecast module identifies the changes in travel mobility caused by the evolution of COVID-19 pandemic and government orders and projects the changes in travel mobility indices relative to the normal level in the U.S. Notably, the change in travel mobility, which affects the frequency of human contact or the level of social distancing, can reciprocally impact the evolution of the pandemic to some extent, as the dashed line shows in the following figure. However, to simplify the model, we ignore the dynamic feedback in the current PODA model version.
- The Motor Gasoline Demand Estimation module estimates vehicle-miles traveled on pandemic days while considering the dynamic indices of travel mobility and quantifies motor gasoline demands by coupling the gasoline demands and vehicle-miles traveled. The COVID-19 pandemic projections in this study are supported by the YYG model,1,2 and the mobility-related information is based on the public data released by Google and Apple, respectively.3–5
References
- U.S. CDC. COVID-19 Forecasts
- Gu Y. COVID-19 Projections Using Machine Learning. About covid19-Projections.com 2020
- Google. COVID-19 Community Mobility Reports 2020
- Apple. Mobility Trends Reports 2020
Collaborators
This study used resources at the National Transportation Research Center (NTRC) at Oak Ridge National Laboratory (ORNL), Aramco Services Company: Aramco Research Center – Detroit, the Department of Mechanical Engineering at Massachusetts Institute of Technology, the Michigan Department of Transportation, and the Energy Systems Center at Argonne National Laboratory. The authors are solely responsible for the views expressed in this study.
Shiqi Ou (Energy and Transportation Science Division, Oak Ridge National Laboratory), Xin He (Aramco Services Company), Weiqi Ji (Department of Mechanical Engineering, Massachusetts Institute of Technology), Wei Chen (Michigan Department of Transportation), Lang Sui (Aramco Services Company), Yu Gan (Energy Systems Division, Argonne National Laboratory), Zifeng Lu (Energy Systems Division, Argonne National Laboratory), Zhenhong Lin (Energy and Transportation Science Division, Oak Ridge National Laboratory), Sili Deng (Department of Mechanical Engineering, Massachusetts Institute of Technology), Steven Przesmitzki (Aramco Services Company), Jessey Bouchard (Aramco Services Company)
Citation
Ou, S., He, X., Ji, W., Chen, W., Sui, L., Gan, Y., Lu, Z., Lin, Z., Deng, S., Przesmitzki, S., & Bouchard, J., 2020, Machine learning model to project the impact of COVID-19 on US motor gasoline demand. https://doi.org/10.1038/s41560-020-0662-1