Battery Electric Vehicles
Electric vehicles are an important emerging technology that has the potential to reduce U.S. petroleum imports and improve energy security. These vehicles can be significantly more energy efficient than conventional petroleum-powered vehicles, but they currently comprise only about one percent of vehicle sales. One of the obstacles to the adoption of battery-electric vehicles (BEVs) is their limited driving range and the associated “range anxiety.” In order for consumers to use these vehicles for longer, inter-city trips, adequate charging infrastructure must be available. Effect deployment of this infrastructure requires that planners and policy makers know where to locate charging stations, when to install them, and how many chargers to allocate at each station in response to the changing BEV market.
Strategic Planning Model
The Transportation Energy Evolution Modeling (TEEM) Program at Oak Ridge National Laboratory (ORNL) has developed a model to help policy makers develop long-term strategies for deploying inter-city charging infrastructure for electric vehicles. The model uses a flow-based multi-stage chance-constrained stochastic modeling framework. The model is described in detail in Long-Term Strategic Planning of Inter-City Fast Charging Infrastructure for Battery Electric Vehicles.
California Inter-city Charging Infrastructure Study
Approach
The TEEM Program used the model to develop a strategy for deploying direct current fast charger (DCFC) stations in California for inter-city BEV trips longer than 100 miles. The study used a 15-year planning horizon from 2015 to 2019, divided into three 5-year planning stages (Stage 1: 2015–2019, Stage 2: 2020–2024, and Stage 3: 2025–2029).
Trip origin and destination (OD) pairs for inter-city travel demand were aggregated over 5,000 transportation Analysis Zones (TAZs) belonging to 482 municipalities and roughly 50 rural areas. Three hundred and eighty-nine (389) locations, with clusters of demand nodes and rest areas were selected as candidate charging stations. BEV demand between OD pairs was estimated for the base year based on light-duty vehicle demand and BEV market share. The base year estimate was then used to project demand for future years.
After the results of the base case scenario were generated. A sensitivity analysis was performed by varying assumptions about level of service, demand, flow, battery size, and range limitation costs.
Results
The model determined the optimal charging station locations and number of chargers for each station for each planning stage. The model predicts that the infrastructure requirements will expand over the time scope of the study. In Stage 1, the infrastructure can cover 99.2% of trips by deploying 226 chargers at 56 locations across the state. In Stage 2, 99.8% coverage can be achieved by 423 chargers deployed at 104 locations. Finally, in Stage 3, 99.8% coverage can be achieved by 618 chargers at 176 locations.

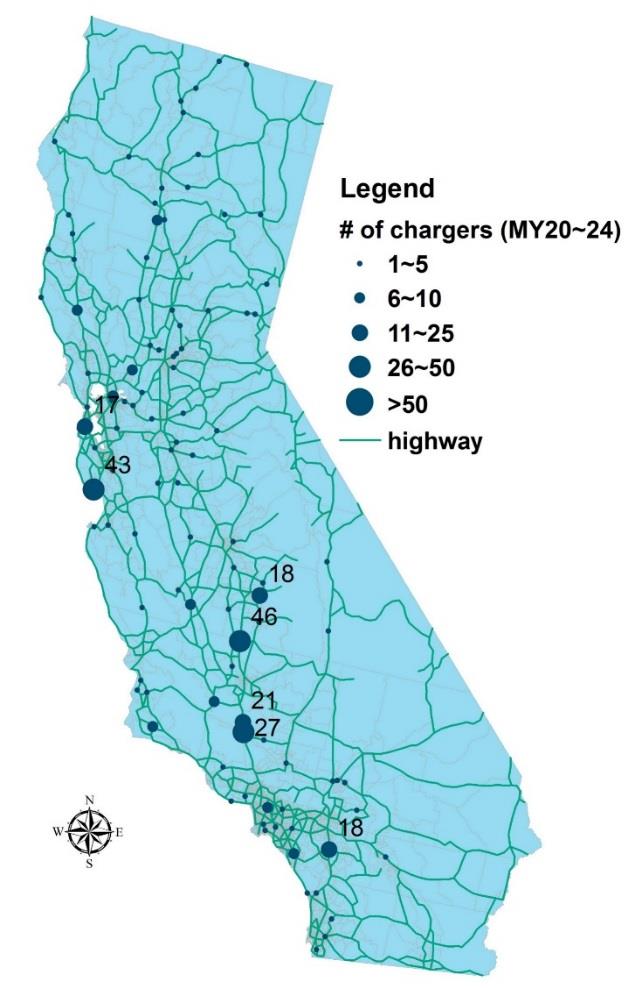
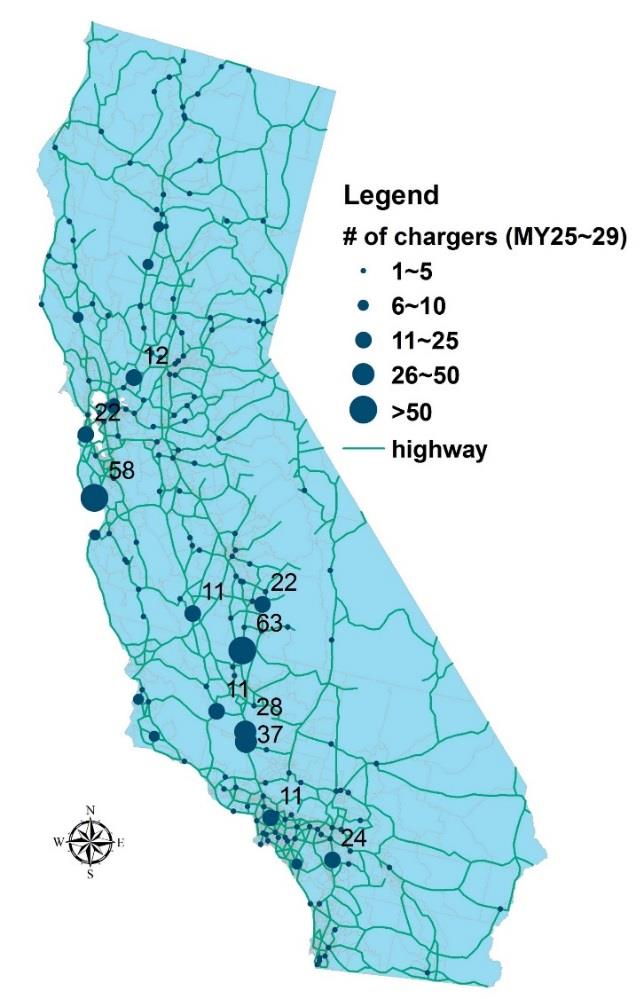
In Stage 1, the number of chargers per location ranges from 1 to 24, with each location having 4 stations on average. The most common configuration is 2 stations per location. In Stage 2, the number of chargers at a location ranges from 1 to 46, with an average of 4 per location. A single charger at a location is the most common configuration. In Stage 3, the number of chargers per location ranges from 1 to 63, with an average of 3.5 stations per location. As in Stage 2, the most common configuration is a single charger at a location.
The sensitivity analysis indicates that the level of service assumption did not significantly change the number of locations but it did change the number of chargers per location. Regarding vehicle range, when range increases, the infrastructure requirement decreases in (1) average number of chargers per location, (2) number of stations, and (3) number of chargers. For most scenarios, it is economical to expand the charging infrastructure even when range limitation cost is reduced. Even though the range limitation cost can go as low as $5 per trip, the model suggests opening 500 chargers to cover about 70% of trips. The results indicate that it is worthwhile to invest in capital-intense inter-city public charging infrastructure.
Conclusions
California dominates today's BEV sales in the U.S., and its zero-emission vehicle (ZEV) action plan is expected to further increase BEV market share. Therefore, the systematic planning of inter-city BEV charging infrastructure is especially crucial to support growing demand. The study concludes that the inter-city charging infrastructure requirement for California will expand roughly three-fold between 2015 and 2029. The study also suggests that it would be economical system-wide to invest in intercity DCFC infrastructure.